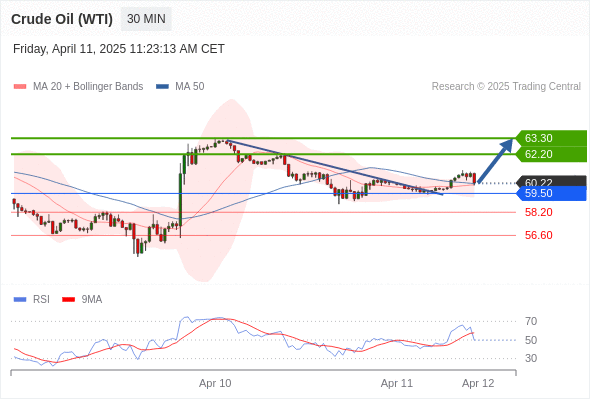
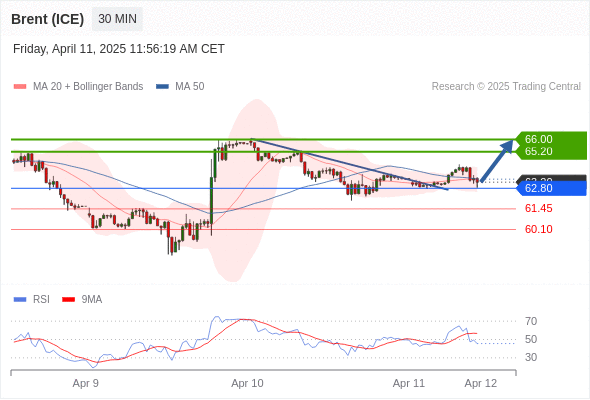
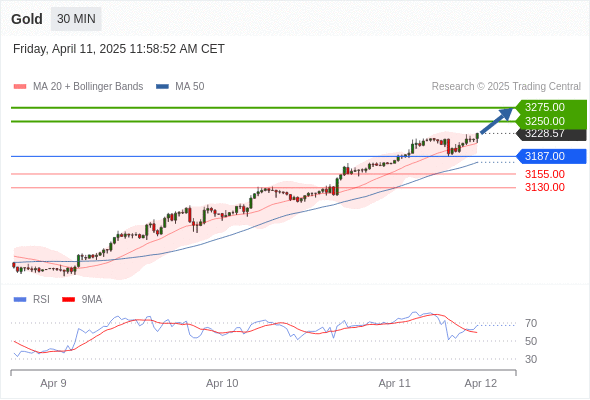
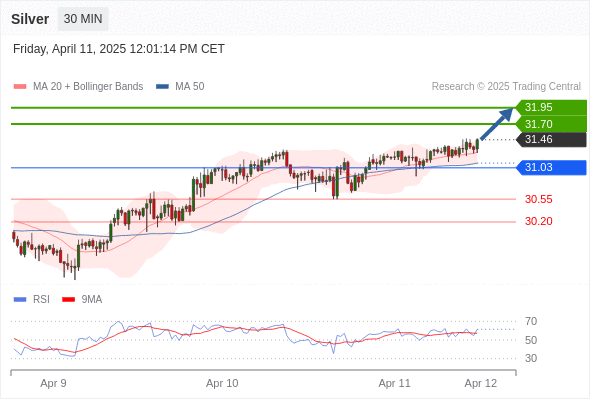
Drive confident decisions with simple, actionable trading plans.

Drive confident decisions with simple, actionable trading plans.

CWG and Trading Central launched The Analyst Views is the world’s only financial market research solution offering the unique and invaluable combination of senior analyst expertise and automated algorithms. Our proprietary pattern recognition is constantly monitoring the market to offer you trading plans based on award-winning methodologies.

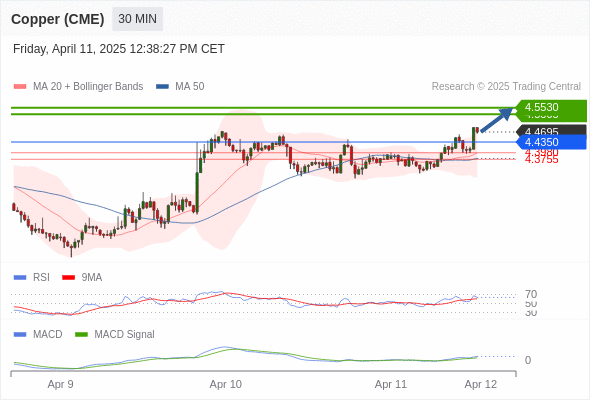
Copper (CME)Copper (CME)

20240726 12:22

media
Copper (CME) (SEP4) intraday: as long as 4.0755 is support look for 4.1620

Our pivot point is at 4.0755.

Our preference: as long as 4.0755 is support look for 4.1620.

Alternative scenario: the downside breakout of 4.0755 would call for 4.0580 and 4.0405.

Comment: the RSI is above its neutrality area at 50. The MACD is below its signal line and positive. The price could retrace. Copper (CME) (SEP4) is below its 20 period moving average (4.1297) but above its 50 period moving average (4.1173).

Supports and resistances:

4.2090 **

4.1915 *

4.1620 **

4.1505

4.1285 last

4.0925

4.0755 **

4.0580 *

4.0405 **

Copper (CME)Copper (CME)

20240726 17:31

media
Copper (CME) (SEP4) intraday: as long as 4.0660 is support look for 4.1575

Our pivot point is at 4.0660.

Our preference: as long as 4.0660 is support look for 4.1575.

Alternative scenario: below 4.0660, expect 4.0485 and 4.0315.

Comment: the RSI is above 50. The MACD is below its signal line and positive. The price could retrace. Copper (CME) (SEP4) is above its 20 and 50 period moving average (respectively at 4.1295 and 4.1260).

Supports and resistances:

4.2040 **

4.1870 *

4.1575 **

4.1460

4.1320 last

4.0835

4.0660 **

4.0485 *

4.0315 **

Corn (CME)Corn (CME)

20240726 17:33

media
Corn (CME) (DEC4) intraday: the downside prevails as long as 416.25 is resistance

Our pivot point is at 416.25.

Our preference: the downside prevails as long as 416.25 is resistance.

Alternative scenario: above 416.25, look for 419 and 420.75.

Comment: the RSI is below 30. It could either mean that prices are in a lasting downtrend or just oversold and therefore bound to retrace (look for bullish divergence in this case). The MACD is negative and below its signal line. The configuration is negative. Corn (CME) (DEC4) stands below its 20 and 50 period moving average (respectively at 418.20 and 419.44).

Supports and resistances:

420.75 **

419.00 *

416.25 **

415.00

414.00 last

410.25

408.50 **

406.75 *

405.25 **

Natural Gas (NYMEX)Natural Gas (NYMEX)

20240726 17:33

media
Natural Gas (NYMEX) (SEP4) intraday: short term rebound towards 2.1400

Our pivot point is at 1.9100.

Our preference: short term rebound towards 2.1400.

Alternative scenario: below 1.9100, expect 1.8600 and 1.8100.

Comment: the RSI is below 50. The MACD is negative and above its signal line. The configuration is mixed. Natural Gas (NYMEX) (SEP4) is trading under both its 20 and 50 period moving average (respectively at 2.0740 and 2.0820).

Supports and resistances:

2.2700 **

2.2200 *

2.1400 **

2.1100

2.0650 last

1.9600

1.9100 **

1.8600 *

1.8100 **

Soybeans (CME)Soybeans (CME)

20240726 17:33

media
Soybeans (CME) (NOV4) intraday: the RSI is oversold

1065.75 is our pivot point.

Our preference: the downside prevails as long as 1065.75 is resistance.

Alternative scenario: above 1065.75, look for 1073.25 and 1077.75.

Comment: the RSI is trading below 30. This could mean that either prices are in a lasting downtrend or just oversold and that therefore a rebound could shape (look for bullish divergence in this case). The MACD is negative and below its signal line. The configuration is negative. Soybeans (CME) (NOV4) is trading under both its 20 and 50 period moving average (respectively at 1071.26 and 1072.09).

Supports and resistances:

1077.75 **

1073.25 *

1065.75 **

1063.00

1058.75 last

1048.25

1043.75 **

1039.25 *

1035.00 **

WARNING and please be advised:

It has come to our attention that a number of unauthorised firms /individuals have cloned our website content, logo and social media pages of CWG Markets Limited. Please be advised that these unauthorised firms have also been contacting consumers via various messaging apps such as WhatsApp, Facebook, Weechat.

It should be noted that there is no connection whatsoever between the CWG Markets Limited, an authorised firm, and the unauthorised entities/ individuals that have cloned our details. Consumers are advised to check the Financial Conduct Authority (‘FCA’) register to verify our firm’s details. Please only contact CWG Markets Limited, using the contact details from the FCA register or the contact details listed on this website. If you’ve been scammed or contacted by an unauthorised firm / individuals – or a firm you suspect is not legitimate – you can report to us support@cwgmarkets.co.uk and also the FCA by contacting their Consumer Helpline /Email

Risk Warning: CFDs are complex instruments and come with a high risk of losing money rapidly due to leverage. The vast majority of retail client accounts lose money when trading in CFDs. Before trading any products supplied by CWG (including subsidiaries and affiliates), you should consider your financial condition, level of experience and risk appetite carefully. You are strongly advised to obtain independent financial, legal and tax advice before proceeding with any currency or spot metals trade. Nothing in this site should be read or construed as constituting advice on the part of CWG or any of its affiliates, directors, officers or employees. Please read and understand the terms and conditions on CWG website before taking any further action.

MT5MT5